
RELIANCE₹1,170.30-0.65%TCS₹2,156.00+3.85%HDFCBANK₹707.25+2.17%INFY₹1,023.40+2.65%ICICIBANK₹1,355.00+0.44%HINDUNILVR₹1,856.70+0.66%ITC₹266.00+4.31%SBIN₹959.10+2.03%BHARTIARTL₹1,805.10+0.03%BAJFINANCE₹960.00+0.42%KOTAKBANK₹441.00+1.38%LT₹3,703.30+2.16%HCLTECH₹1,216.70+3.38%AXISBANK₹1,259.10+1.13%ASIANPAINT₹2,339.10+1.19%MARUTI₹11,420.00+1.71%RELIANCE₹1,170.30-0.65%TCS₹2,156.00+3.85%HDFCBANK₹707.25+2.17%INFY₹1,023.40+2.65%ICICIBANK₹1,355.00+0.44%HINDUNILVR₹1,856.70+0.66%ITC₹266.00+4.31%SBIN₹959.10+2.03%BHARTIARTL₹1,805.10+0.03%BAJFINANCE₹960.00+0.42%KOTAKBANK₹441.00+1.38%LT₹3,703.30+2.16%HCLTECH₹1,216.70+3.38%AXISBANK₹1,259.10+1.13%ASIANPAINT₹2,339.10+1.19%MARUTI₹11,420.00+1.71%
Nifty 100 (CNX100)
NSE
N/A
Market closed · Price temporarily unavailable
Nifty 100 (CNX100) today. Live chart on NSE.
History · TechGraph Market DataLast chart bar · Oct 9, 9:15 AM Asia/Kolkata
People also watch
Trending global stocks
About Nifty 100

Nifty 100 combines the Nifty 50 and Nifty Next 50 into a broad large-cap benchmark.
Key financial metrics
Financial Highlights
| Profit Margin | N/A |
| Operating Margin | N/A |
| Return on Assets | N/A |
| Return on Equity | N/A |
| Revenue | N/A |
| Quarterly Revenue Growth | N/A |
| Diluted EPS | N/A |
Balance Sheet
| Total Cash | N/A |
| Total Debt | N/A |
| Total Debt/Equity | N/A |
| Current Ratio | N/A |
| Book Value Per Share | N/A |
Cash Flow Statement
| Operating Cash Flow | N/A |
| Levered Free Cash Flow | N/A |
Share Statistics
| Avg Vol (3 month) | N/A |
| Shares Outstanding | N/A |
| Float | N/A |
| Short Ratio | N/A |
| Short % of Float | N/A |
Major Holders
| % of Shares Held by All Insiders | N/A |
| % of Shares Held by Institutions | N/A |
| % of Float Held by Institutions | N/A |
| Number of Institutions Holding Shares | N/A |
Financial statement fields will appear when the market-data feed provides usable fundamentals for this instrument.
Technical analysis
Summary
Sell
Last price is below the short and medium moving averages. RSI 36.2, MACD negative. Trend: downtrend.
TrendDowntrend
RSI (14)36.2
MACD-378.379
SMA 20₹24,086.45
SMA 50₹24,858.99
SMA 200₹25,153.76
Support₹23,266.75
Resistance₹25,565.65
Stochastic %K24.7
ATR (14)279.157
| Indicator | Call | Detail |
|---|---|---|
| Price vs SMA 20 | Sell | Last close is below the 20-session average. |
| Price vs SMA 50 | Sell | Medium-term trend is down. |
| SMA cross | Sell | The 20-session average is below the 50-session average. |
| RSI (14) | Neutral | RSI is in the mid-range. |
| MACD | Sell | MACD line is below zero. |
| Stochastic | Neutral | Stochastic is mid-range. |
Company profile
Sector
IndustryN/A
EmployeesN/A
CEON/A
Website
N/A
News & official updates
 TechGraph News · 2023-10-06Future of Stock Market Learning In India: An Interview with StockGro’s Ajay Lakhotia
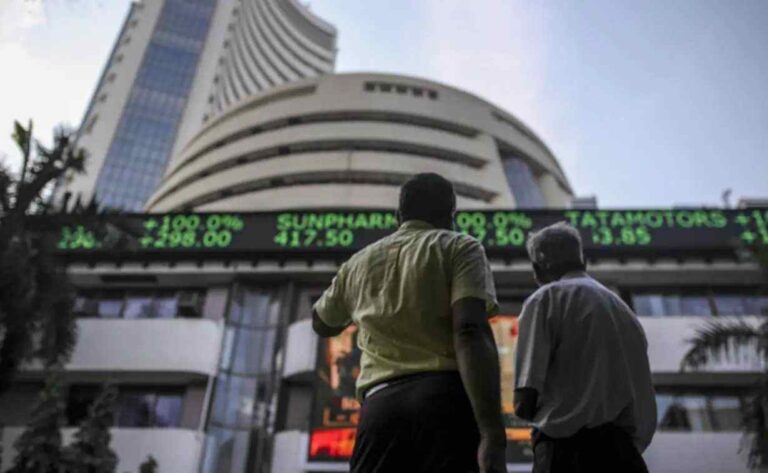 TechGraph News · 2023-05-20Stock Market Slips as Global Markets Remain Uncertain, BSE IT & Reality Bucks the Trend; Investors Eye Q4FY23 Results
TechGraph News · 2023-01-05Jan 05: Stock Market Update by Shrikant Chouhan, Kotak Securities
TechGraph News · 2020-06-18Market Analysis: Focus will be on the Bank of England MPC meeting
TechGraph News · 2020-04-09Market Analysis: Dow ends above 23,000 mark for the first time in a month
TechGraph News · 2020-04-01Market Analysis: Crude drops to 18-year lows
Nifty 100 — frequently asked questions
What is Nifty 100 today?
Nifty 100 today is the live reading at the top of this page, with the chart and the day’s move.
Where is Nifty 100 listed?
Nifty 100 trades as CNX100 on NSE.
Price quotes refresh periodically while this page stays open; the chart follows the quote and refreshes exchange history less often. Some venues delay data by 0–15 minutes. When the market is closed, the last recorded session price is shown. Fundamentals refresh on a slower schedule.